Sierra API and Visualized Data Analysis
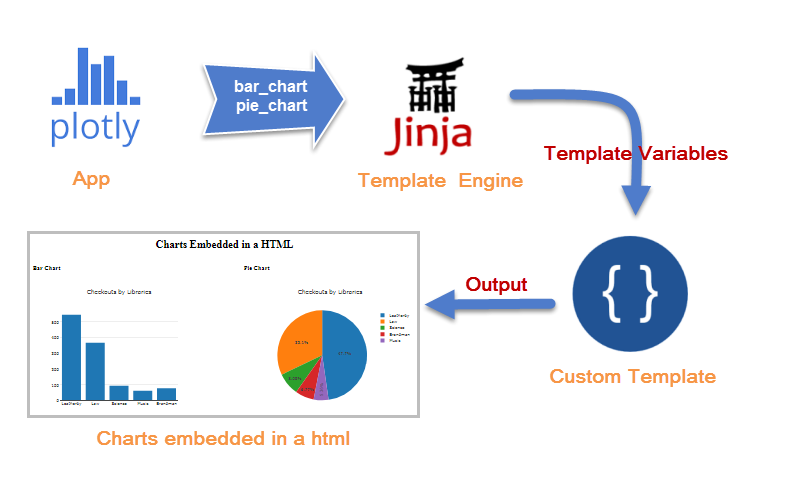
This is one of presentation slides that I prepared for 2017 SCIUG conference presentation. I used Plotly library to visualize library business data. Data come through Sierra SQL API. Plotly has Python offline plotting APIs, which are very useful to chart data in the back-end.